Trains That Make Up the Most Lost Time, 26 Sep to 9 Oct 2026
Fifteen trains that made up the most time per run in our own tracking, 26 September to 9 October 2026, with on-time rates and the caveats that apply.
 TrainLiveStatus Desk · Updated · 4 min read
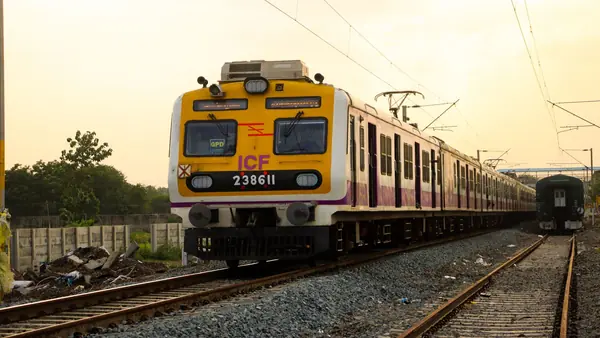
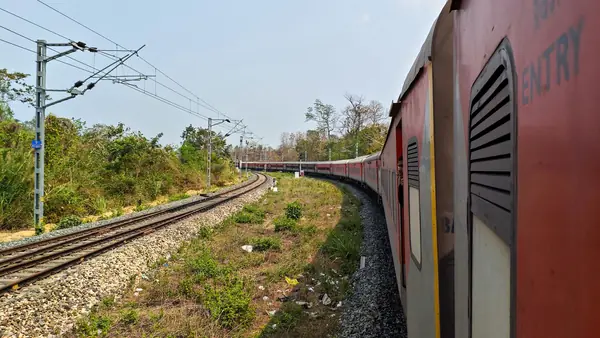
Photo: GOWTHAM AGM / Pexels
Between 26 September and 9 October 2026, the trains that made up the most time were also among the most delayed in our tracking. The Howrah Mail (12809) recovered an average of 268 minutes per run, but its average maximum delay was 297 minutes. This report lists the 15 trains with the highest average recovery, with the method and caveats that apply.
How we measured it
For each day, the delay we record for a train is the largest delay reported during that day's run, in minutes. A run counts as on time if that figure is within 15 minutes. The figure in this report, minutes recovered, is the average amount of time a train made up per run in our tracking. The window covers 14 days. 6,902 trains were in scope and 5,423 made the ranking. This is our own delay history, not an official railway statistic.
Across all trains in scope, the average maximum delay was 49 minutes and 40% of runs were on time. Every train in the table below sits far from that average.
The 15 trains that made up the most time
The list is ranked by average minutes recovered, highest first. Each train links to its live status and delay history page.
| Rank | Train | Route | Days observed | Avg max delay | Avg minutes recovered |
|---|---|---|---|---|---|
| 1 | 12809 Howrah Mail | Mumbai CSMT to Howrah | 14 | 297 min | 268 min |
| 2 | 01450 DNR PUNE Special | Danapur to Pune | 14 | 362 min | 195 min |
| 3 | 12860 Gitanjali Express | Howrah to Mumbai CSMT | 14 | 248 min | 184 min |
| 4 | 12130 Azad HIND Express | Howrah to Pune | 14 | 401 min | 182 min |
| 5 | 01449 PUNE DNR Special | Pune to Danapur | 14 | 326 min | 172 min |
| 6 | 64051 Ksv-gzb EMU | Kosi Kalan to Ghaziabad | 13 | 252 min | 168 min |
| 7 | 12833 ADI HWH Express | Ahmedabad to Howrah | 14 | 283 min | 167 min |
| 8 | 18477 Utkal Express | Puri to Yog Nagari Rishikesh | 11 | 189 min | 167 min |
| 9 | 18478 Kalingautkal Express | Yog Nagari Rishikesh to Puri | 13 | 372 min | 165 min |
| 10 | 12129 Azad HIND Express | Pune to Howrah | 14 | 329 min | 156 min |
| 11 | 63202 Spj-bju MEMU | Samastipur to Barauni | 14 | 313 min | 152 min |
| 12 | 12203 Garib Rath Express | Saharsa to Amritsar | 10 | 265 min | 150 min |
| 13 | 12413 Galtadham Pooja | Ajmer to Jammu Tawi | 14 | 241 min | 138 min |
| 14 | 18029 LTT Shalimar Express | Lokmanya Tilak Terminus to Shalimar | 14 | 182 min | 137 min |
| 15 | 04013 LKQ ANVT Special | Laukaha Bazar to Anand Vihar Terminal | 14 | 266 min | 134 min |

Every train in the table had an on-time rate of 0% over the window, so none of their observed days had a largest delay within 15 minutes. Two trains were cancelled on some days: the Utkal Express (18477) on 3 days and the Kalingautkal Express (18478) on 1 day.
What the figures show
- Recovery follows delay. A train can only make up time after it has fallen behind. The trains with the largest recovery also had large delays to start with, so a high figure is a sign of a big delay, not of a train that is running well.
- The Utkal Express starts from a smaller delay. Its average maximum delay of 189 minutes is below most of the table, yet it still recovered 167 minutes per run on average. It was observed on 11 days, with the other 3 days cancelled.
- Shorter runs appear too. The Spj-bju MEMU (63202) covers roughly 50 km, and the Ksv-gzb EMU (64051) roughly 120 km. Their place in the table shows that recovery is not limited to long-distance trains.
Caveats for reading this data
The sample covers 14 days, and most trains were observed on every one of them. Our data shows how much time each train made up per run. It does not show why a train made up time, and we have not analysed causes for any delay here.
For a general explanation of why trains run late, read the guide to why trains run late. The earlier week's report on the most delayed trains covers the same kind of data for a shorter window, and the most punctual trains covers the other end of the scale.

What to do if your train is on this list
Check the train's own page for its recent delay history before you travel, so you know what a typical run looks like. On the day, track the train with live running status and plan any connection with some margin. If your journey depends on one of these trains, the trip planner can show alternatives on the same route.
Our figures show delays and recoveries as reported, so the arrival time on the day is the number to plan around.
Where is your train right now?
Live position, expected arrival at every stop and the delay history of the last few weeks.
Use it on your trip
Frequently asked questions
What does minutes recovered mean in this report?
It is the average number of minutes a train made up per run in our tracking, between 26 September and 9 October 2026. A train can only recover time after it has fallen behind, so a high figure means a large delay that was partly reduced.
Did any of these trains run on time during the window?
No. Every train in this table had an on-time rate of 0% over the window. On-time means the largest delay reported in a day's run was within 15 minutes.
Why do some trains appear here with cancelled days?
The Utkal Express (18477) was cancelled on 3 days in the window and the Kalingautkal Express (18478) on 1 day. Their averages are based on the days they were observed.
Is this an official railway statistic?
No. This is our own delay history, built from the delays we record during each day's run. It is not an official figure from Indian Railways.